
Week 7 Notebook
Luke Altmyer’s national perception, Hank Beatty’s breakout, EPA by position group, and more

Luke Altmyer: National Perception vs Statistical Reality
Luke Altmyer isn’t getting much national recognition, and that’s understandable. It’s difficult for national media to be knowledgeable about every team and every player. Still, I recently listened to the College Football Enquirer podcast, where they described Altmyer as “fine”.
“Fine”
As someone who likes to dig deeper, I wanted to pull together as much information as possible to see how Luke Altmyer actually compares to his peers and the eye test.
Let’s start with ESPN’s Bill Connelly, who runs a weekly Heisman voting system using an F1-style points structure (10 points for first place, 9 for second, and so on). Luke Altmyer currently ranks second in Connelly’s Heisman standings, consistently stringing together strong performances outside of the Indiana game.
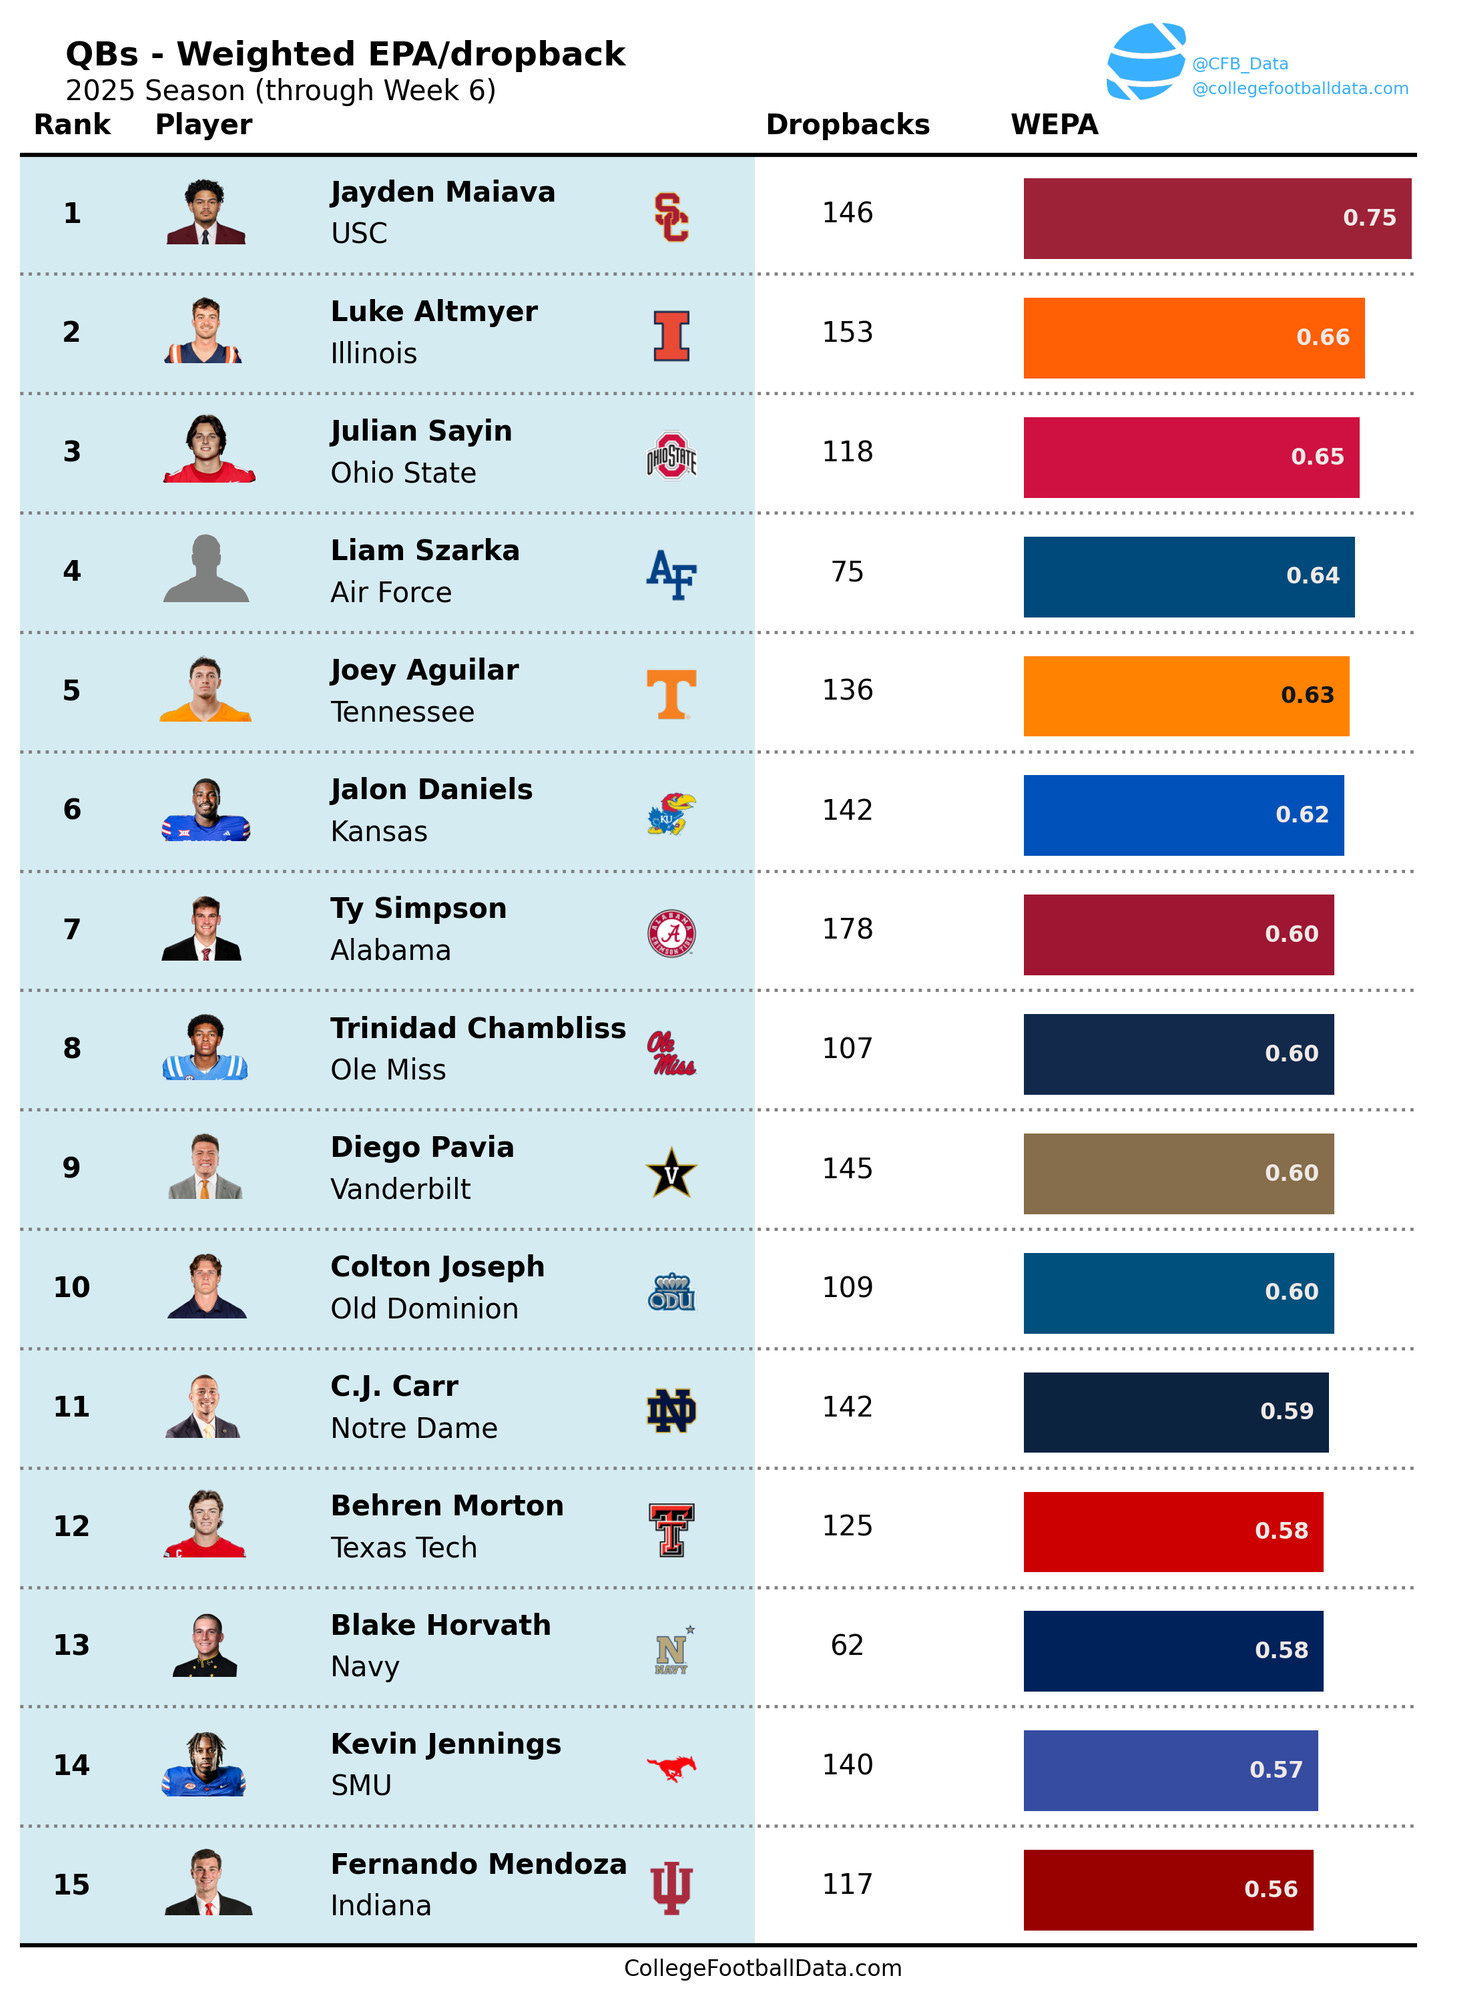
On a more analytical level, we turn to Weighted EPA per Dropback. For every play, we know the ball’s location, the down and distance, and the time remaining in the quarter. With that information, we can calculate the probability of scoring and determine how many expected points a team has in that specific situation.
Below is an NFL chart that helps visualize this concept, showing how expected points shift based on where an offense has the ball on the field and what down it is.

Expected Points Added (EPA) measures how much a play changes that expectation, whether it increases or decreases a team’s likelihood of scoring. f it’s 2nd down at the Illinois 20 and Altmyer throws an incompletion or takes a sack, Illinois’ probability of scoring decreases, giving him negative EPA for that play. But if he connects with Hank Beatty for a 30-yard completion, Illinois’ scoring probability increases, resulting in positive EPA.
The simplest way to think about it: EPA measures how often a quarterback produces a positive or negative play. Ranking highly means the QB is consistently generating positive outcomes for the offense.
Luke Altmyer currently is second in the country behind only Jayden Maiava of USC in EPA per drop back.
According to PFF.com, Luke Altmyer ranks 8th among Big Ten quarterbacks in passing grade. Consistency plays a major role in season-long PFF metrics, and Altmyer’s clunker against Indiana — a 38.1 passing grade — drags his overall ranking down. That game likely shaped the national perception as well, since it was one of the few Illinois games widely discussed.
We may be seeing too much weight put into that single game. If 75% of someone’s opinion of Altmyer comes from watching that Indiana game and only 25% from everything else this season, then “fine” becomes an understandable descriptor. We may be seeing too much weight put into the Indiana game.
Altmyer is 3rd among Big Ten QB’s in Passer Rating.
Altmyer is averaging 10.6 yards per passing attempt, almost double that of Iowa’s Gronowski.
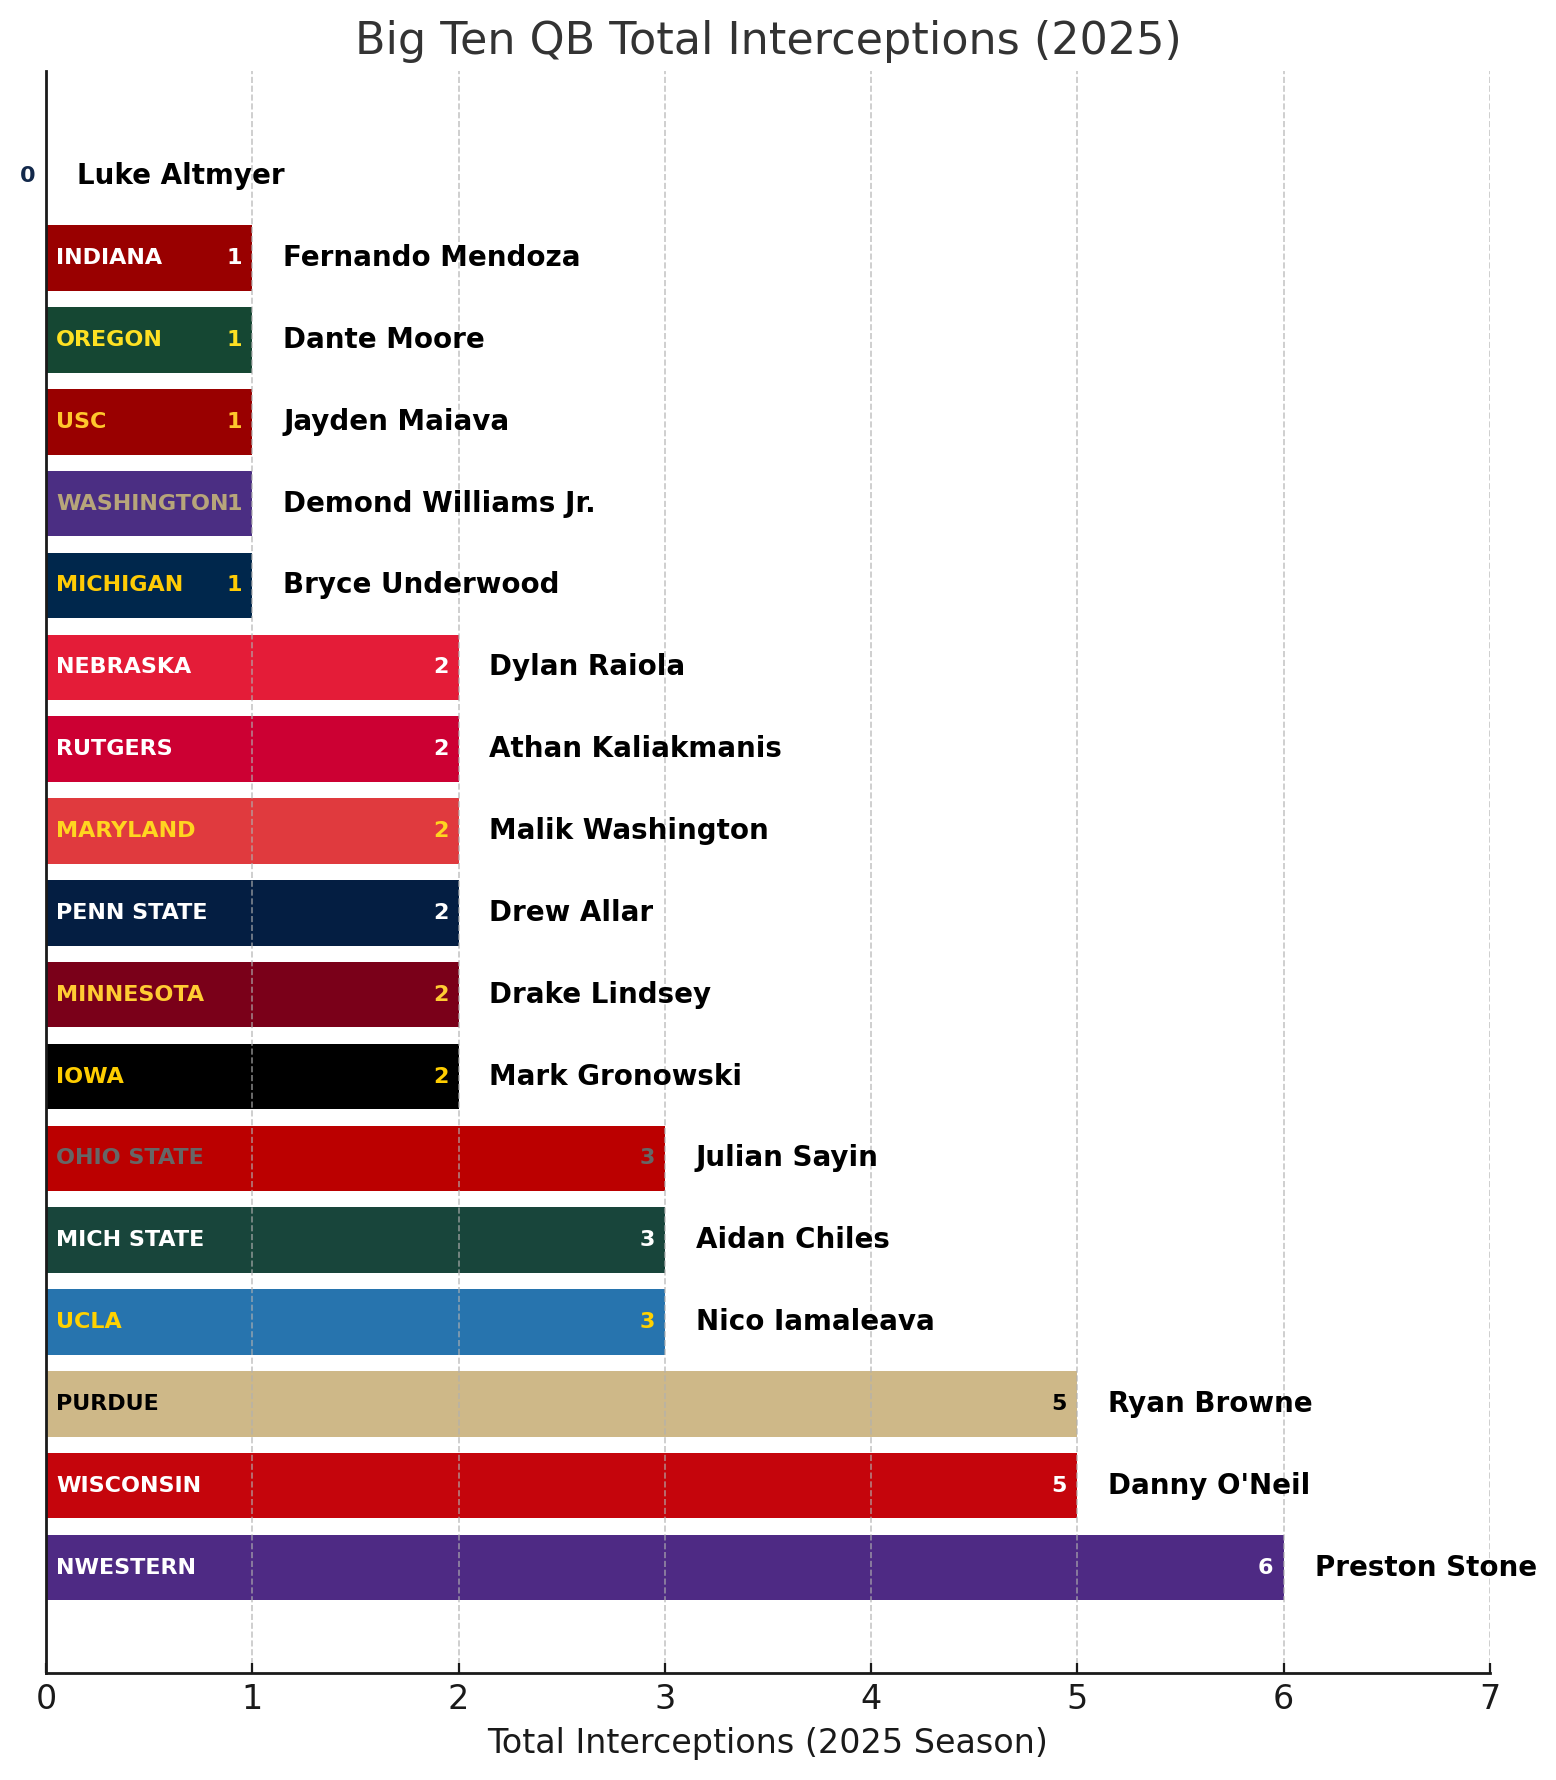
Altmyer has protected the ball. He’s thrown for 1,573 yards this season — 2nd in Big Ten behind Maiava — and has yet to throw an interception.
The main knock on Luke Altmyer in his first season at Illinois was interceptions. In his first three games, he threw seven picks, but over his final six games, that number dropped to three. The improvement was clear, but it came with a side effect. Altmyer became more conservative and started taking more sacks.
It’s a fine balance between interceptions and sacks. You can’t put the ball in harm’s way, but you also have to give your receivers a chance to make plays. Of course, not every sack is on the quarterback. Play calling, receiver separation, and pass protection all factor in. Still, the QB controls pre-snap recognition, pocket presence, and time to throw.
The table below shows how often Big Ten quarterbacks are pressured and sacked on third and fourth down dropbacks this season. Altmyer has 47 dropbacks in those situations and has been sacked 12 times. That’s a 25.2% sack rate while being pressured on 46.8% of dropbacks
For comparison, USC’s Jayden Maiava has 38 late-down dropbacks, 18 pressures, and zero sacks. That’s a slightly higher 47.4% pressure rate but a 0% sack rate.
A lot of quarterbacks face pressure, but Altmyer has to do a better job of handling it when it comes. The good news is that this area has shown improvement. In Illinois’ first two Power Conference games, Altmyer was sacked 11 times. Over the last two, that number dropped to just three.
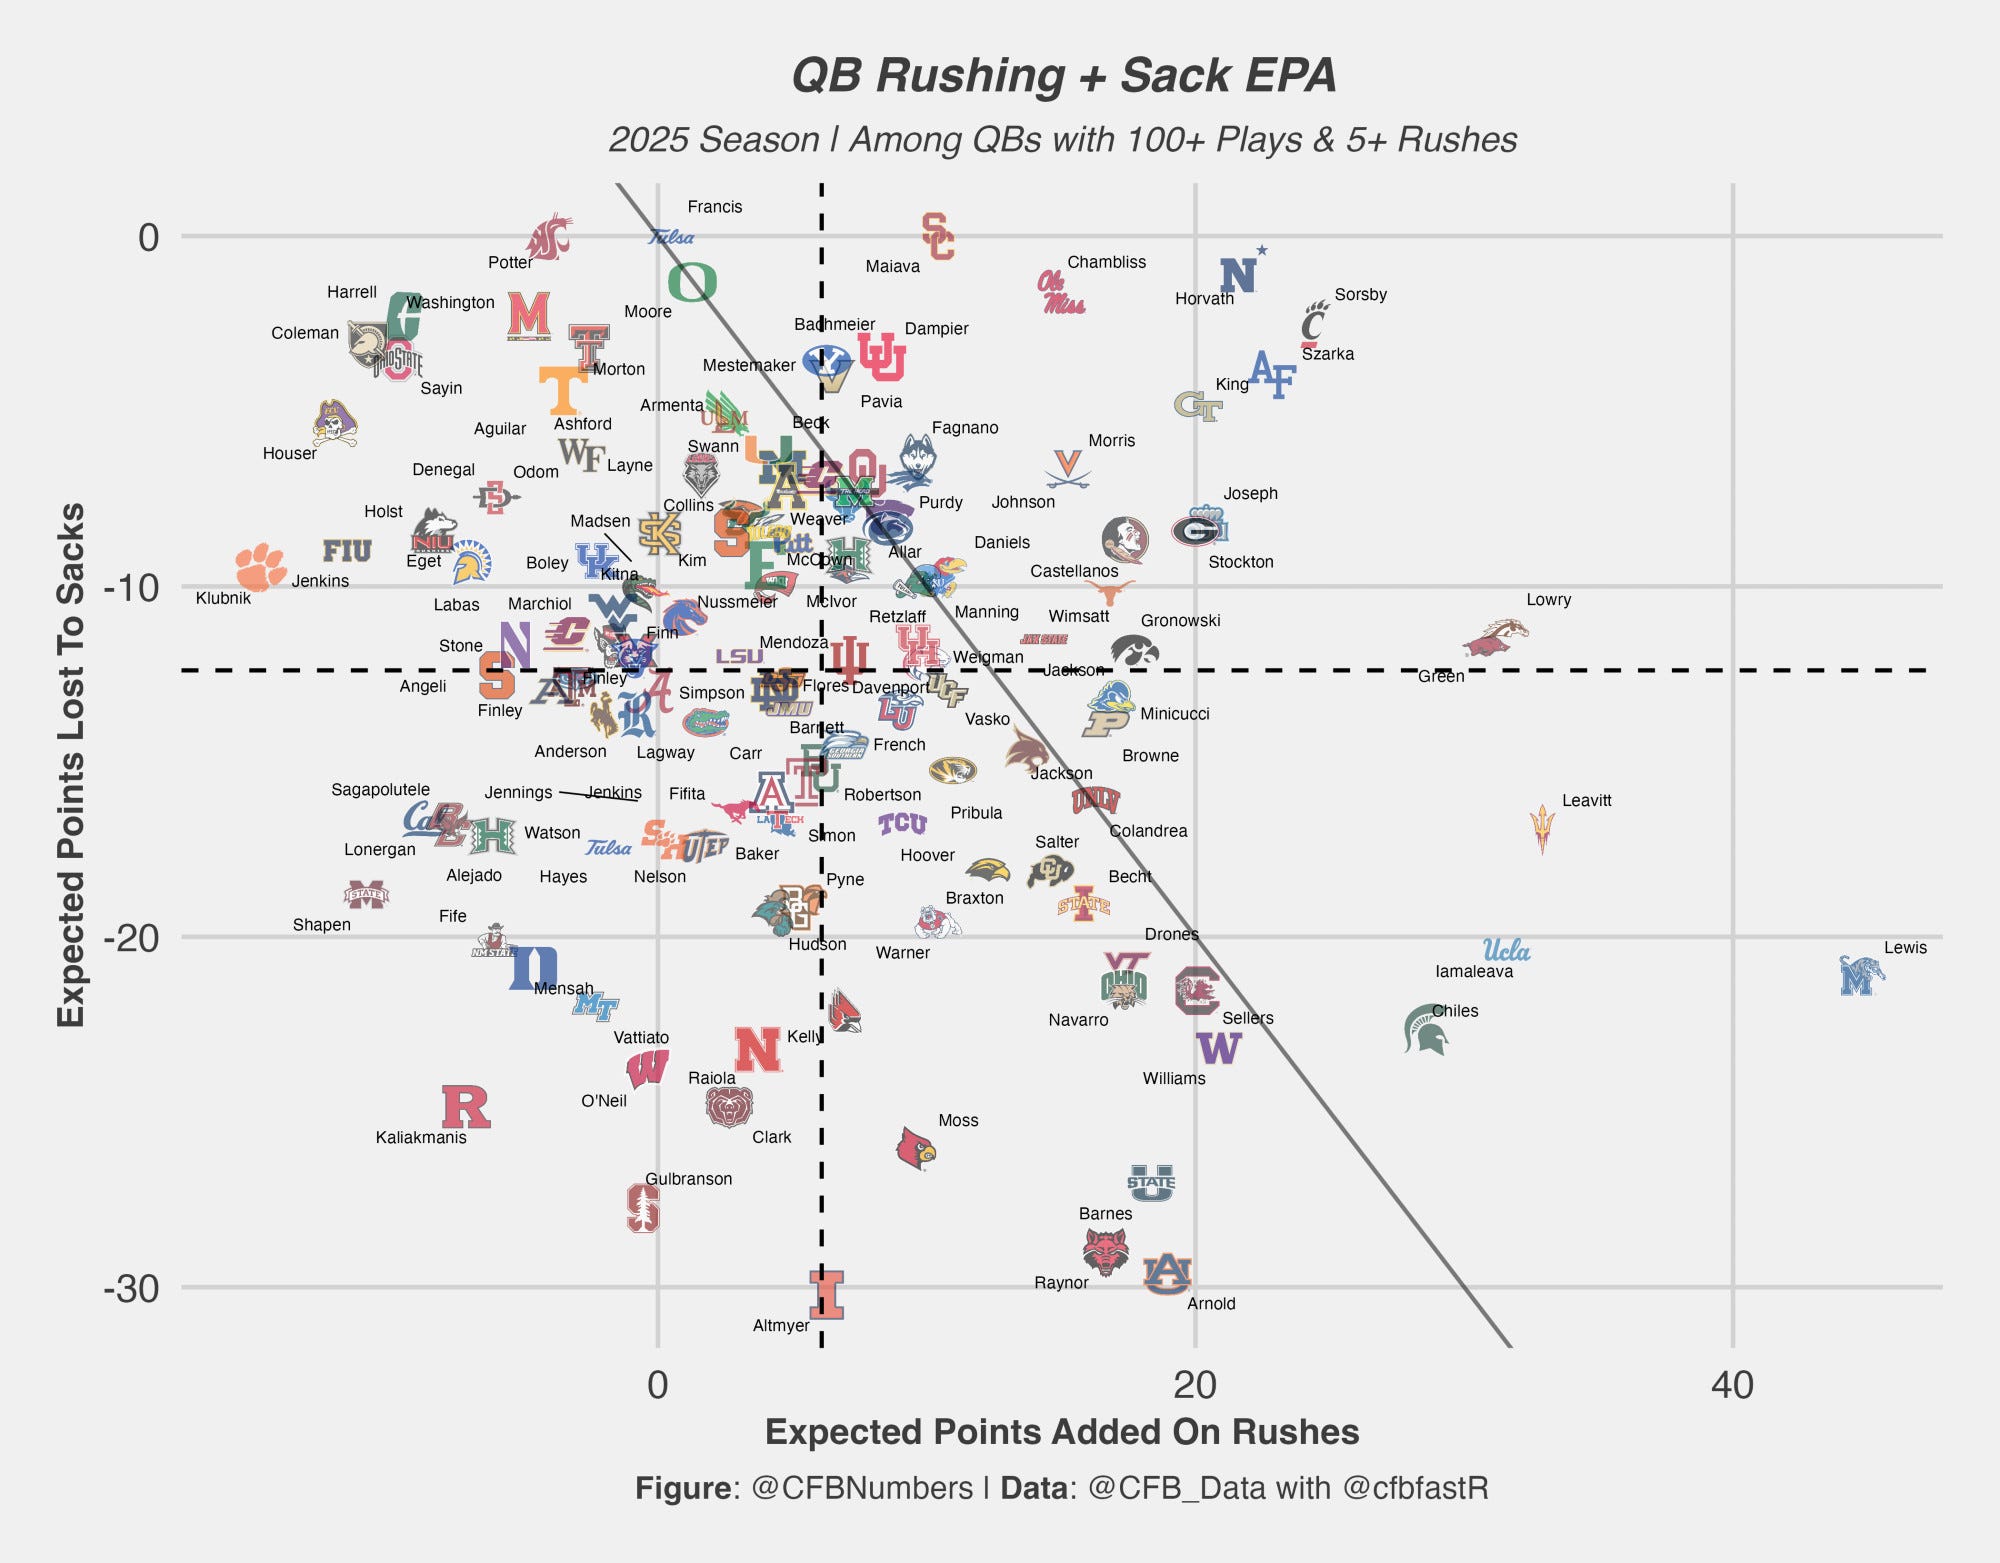
The below chart is from @CFBnumbers.bsky.social and you can check out their substack here
While this chart also includes quarterback rushing, the focus here is on the sack portion. The vertical axis shows expected points lost to sacks, the higher a player is, the fewer sacks they’ve taken and the less they’ve hurt their offense. The lower you go, the more frequent and costly the sacks have been.
Altmyer sits at the very bottom. No quarterback in college football has cost his offense more expected points through sacks than Luke Altmyer
Look, obviously I pulled metrics that paint Luke Altmyer in a good light and only a few that didn’t. There are plenty of other stats that show him as a mostly above-average Big Ten quarterback.
And maybe there’s some historical context at play here. Illinois hasn’t had a truly elite quarterback in decades. Altmyer might be the best since Kurt Kittner. Maybe Illini fans overrate him a bit because they haven’t seen this level of quarterback play in more than twenty years. Or maybe Illinois just doesn’t win in flashy ways that grab national attention.
But here’s the thing… Luke Altmyer is a dude.
No disrespect to Illinois. There are good players on this roster, even future NFL players. But what stands out most about Altmyer is what he’s doing with what surrounds him. Tommy DeVito had one of the best defenses in program history and a running back now starting for the Cincinnati Bengals. Altmyer, on the other hand, has been winning games the last two seasons with units along side him that have graded out as average or below-average across the Big Ten, in pass defense, run defense, and the run game itself.
He’s had some weapons — Pat Bryant was a third-round pick — but even so, the Illinois passing offense under Altmyer has been exceptional. Last season, the top five Big Ten teams in EPA per pass were Ohio State, Indiana, Penn State, Oregon, and Illinois. This season, it’s Indiana, USC, Illinois, Ohio State, and Oregon. Luke Altmyer has put this passing offense on par with these elite teams.
Replace Luke Altmyer with Brandon Peters. Hell, replace him with Tommy DeVito. How many games is Illinois winning? They’re not going 10-3 last year, and they’re not 4-1 this year. Illinois had a below average EPA per pass in 2022 with Tommy DeVito under center for example. DeVito was a great game manager, but he’s no Luke Altmyer.
Illinois is where they at because Luke Altmyer is a great quarterback. One only wonders what he would have done at a program like Oregon, Ohio State, or Penn State with so much around him. I can safely say Luke Altmyer is one of the best QB’s in the Big Ten. A good showing even in a loss vs Ohio State would go a long way to helping those outside of Champaign start to recognize his talent.
LOL Penn State
Real quick, I have to point out this Penn State stat, because it honestly blew me away.
Penn State. The team with four 5-stars and fifty-eight 4-stars on the roster. The team with a senior quarterback who was once the No. 1 QB recruit in his class.
And yet, here’s the number: Success rate on 3rd-down passes this season. How often Big Ten teams create a positive play when throwing on 3rd down.
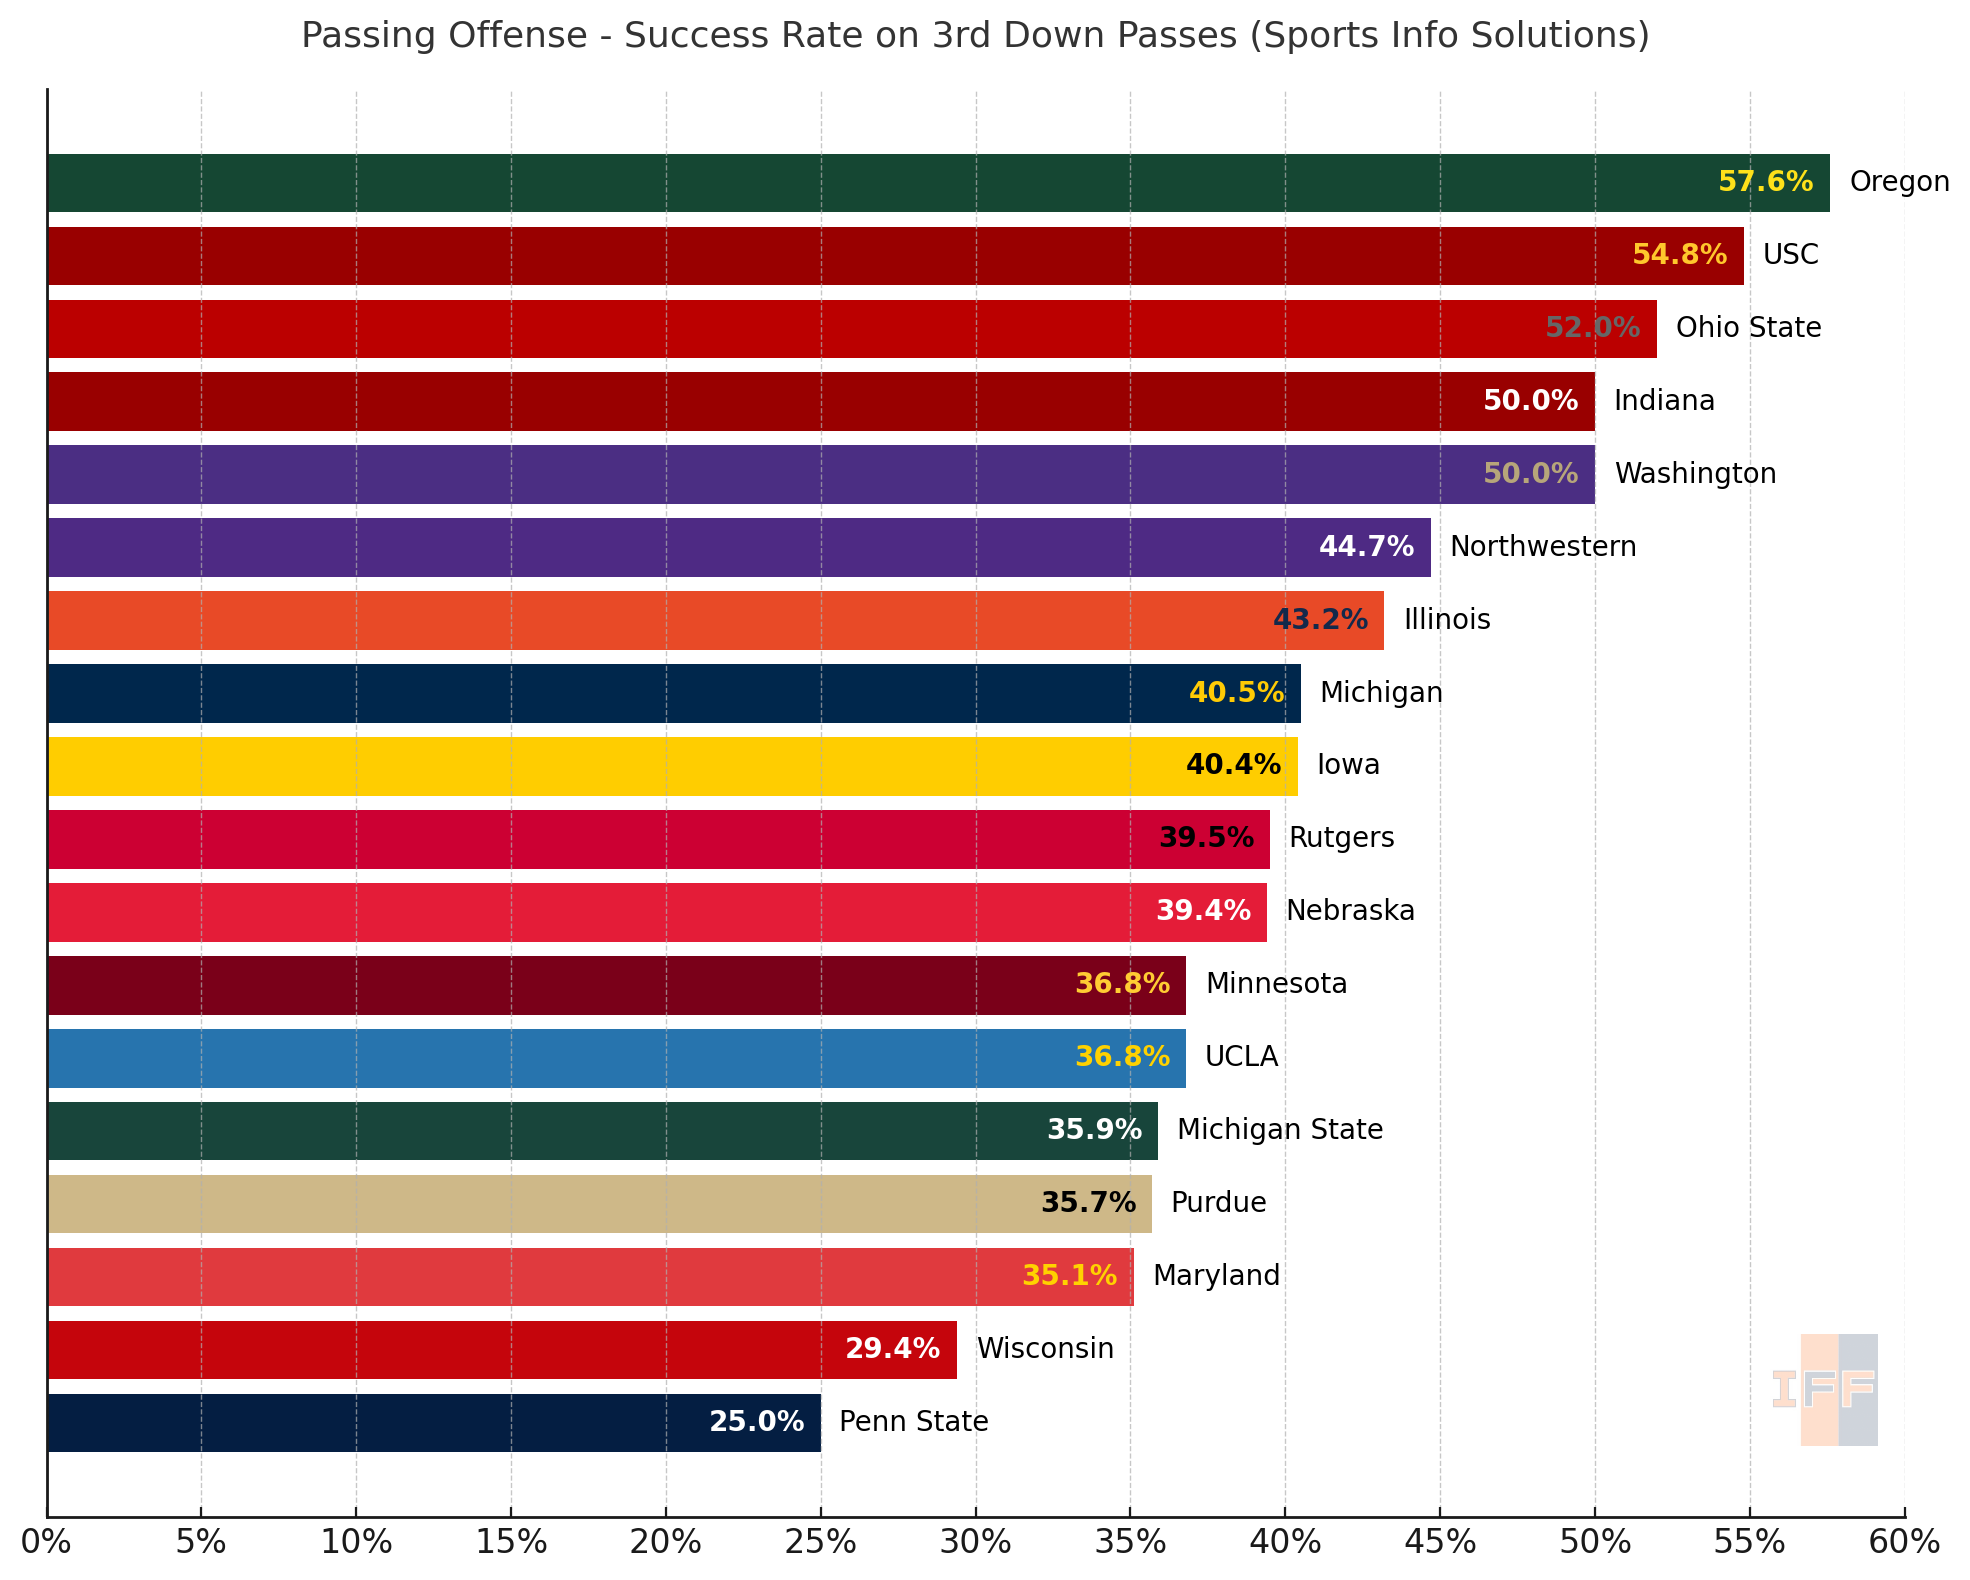
Penn State only has a 25% success rate on 3rd down passes this season, last in the Big Ten. Just wild.
Speaking of players not getting much national love
Let’s talk about Hank Beatty.
He isn’t one of the nearly sixty names on the 2025 Biletnikoff Award watch list, which recognizes the most outstanding receiver in college football.
Yet Beatty ranks third in the entire FBS in yards after catch among wide receivers.
Hank Beatty also has the fourth most Expected Points Added this season among FBS WR’s
On PFF.com among FBS WR’s Hank Beatty has the 3rd best offensive grade and 4th best receiving grade. He’s absolutely been one of the best 50 wide receivers in College Football this season. Coach Bielema agrees:
“I get pissed as hell at the ‘Biletnikoff’ for giving us the shoulder on Hank Beatty. I have to convince those people what’s happening with Beatty isn’t by chance. They saw Pat Bryant and Isaiah Williams before. You have to build a foundation off the guys before you.” - Illinois Head Coach Bret Bielema
EPA For Position Groups
If you like stats, I really recommend checking out CFB-Graphs. It’s run by Parker Fleming, the same person who creates the matchup previews I often share. He’s been expanding the site lately and has started including player-level data too and it’s free!
The Hank Beatty YAC numbers came from there. And since we’ve talked so much about EPA in this post, it’s a good time to look at how Illinois players stack up by position group in that metric.
Running Backs EPA per Rushing Attempt
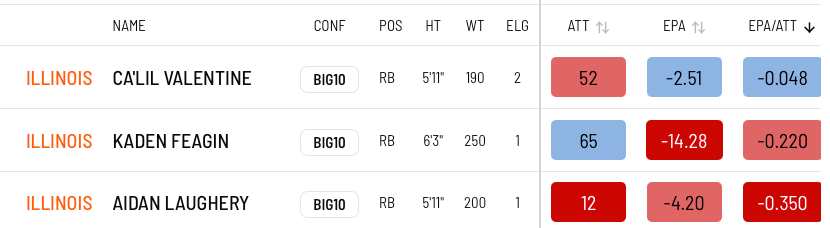
Ca’lil Valentine is slowly emerging as Illinois’ lead running back. Kaden Feagin is a strong option and should be used more in the passing game, getting him into space where he can bulldoze defensive backs. But between the tackles, Feagin’s limited cutting and vision make him more of a straight-line runner. If the blocking isn’t there, he’s not the type to create much on his own.
Valentine, on the other hand, has the juice. Like Chase Brown, he can make defenders miss and mask poor blocking with his vision and agility. He’s also shown more power than expected for his frame. It’s going to be fun watching him develop. Illinois hasn’t had a truly elite running back since Chase Brown, and Valentine has the potential to become that as an upperclassman.
Wide Receiver EPA per Target
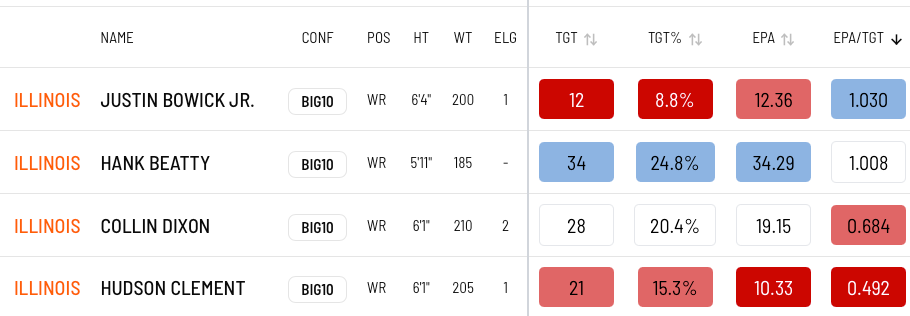
Hank Beatty has been Illinois’ top receiver this season, evident from his 34.29 EPA on 34 targets. However, Justin Bowick actually leads the team in EPA per target, which suggests he deserves a larger share of the passing volume moving forward. Collin Dixon has also been strong, his 19.15 total EPA ranks 12th among Big Ten receivers, just behind Ohio State’s Jeremiah Smith.
If we lower the minimum target threshold to 12 to capture all of Illinois’ primary receivers, here’s how they stack up among Big Ten wideouts in EPA per target:
Bowick – 3rd
Beatty – 4th
Dixon – 12th
Clement – 21st
Illinois has quietly built one of the most efficient receiving corps in the conference. Of course, Altmyer deserves credit too. He’s been throwing absolute dimes, like the deep shots to Beatty and Dixon against Purdue. The preseason concern about replacing Pat Bryant and Zakhari Franklin no longer feels like a concern at all.
Tight End EPA per Target
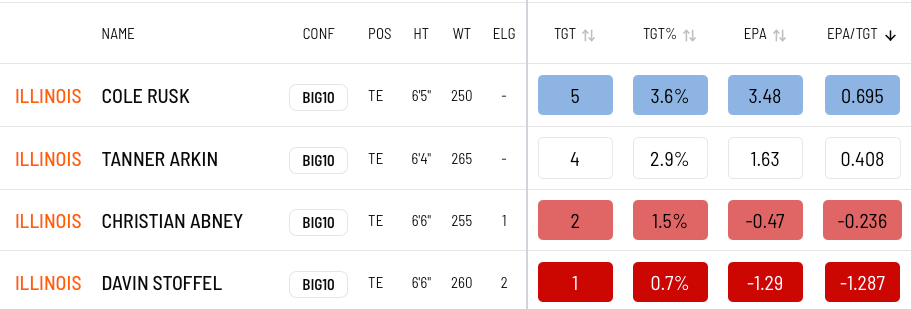
There isn’t much to take away from the tight end stats simply because there haven’t been many targets. Still, Illinois could benefit from getting them more involved, especially when the run game stalls. The classic chip-and-release route could help: have the tight end deliver a brief block before slipping into the flat as a safety valve. A 4-yard reception is better than getting consistently stuffed in the run game.
Fun Fact: The last Illini tight end to finish a season with at least 20 receptions was Louis Dorsey in 2017.
Ohio State vs Illinois Outlook
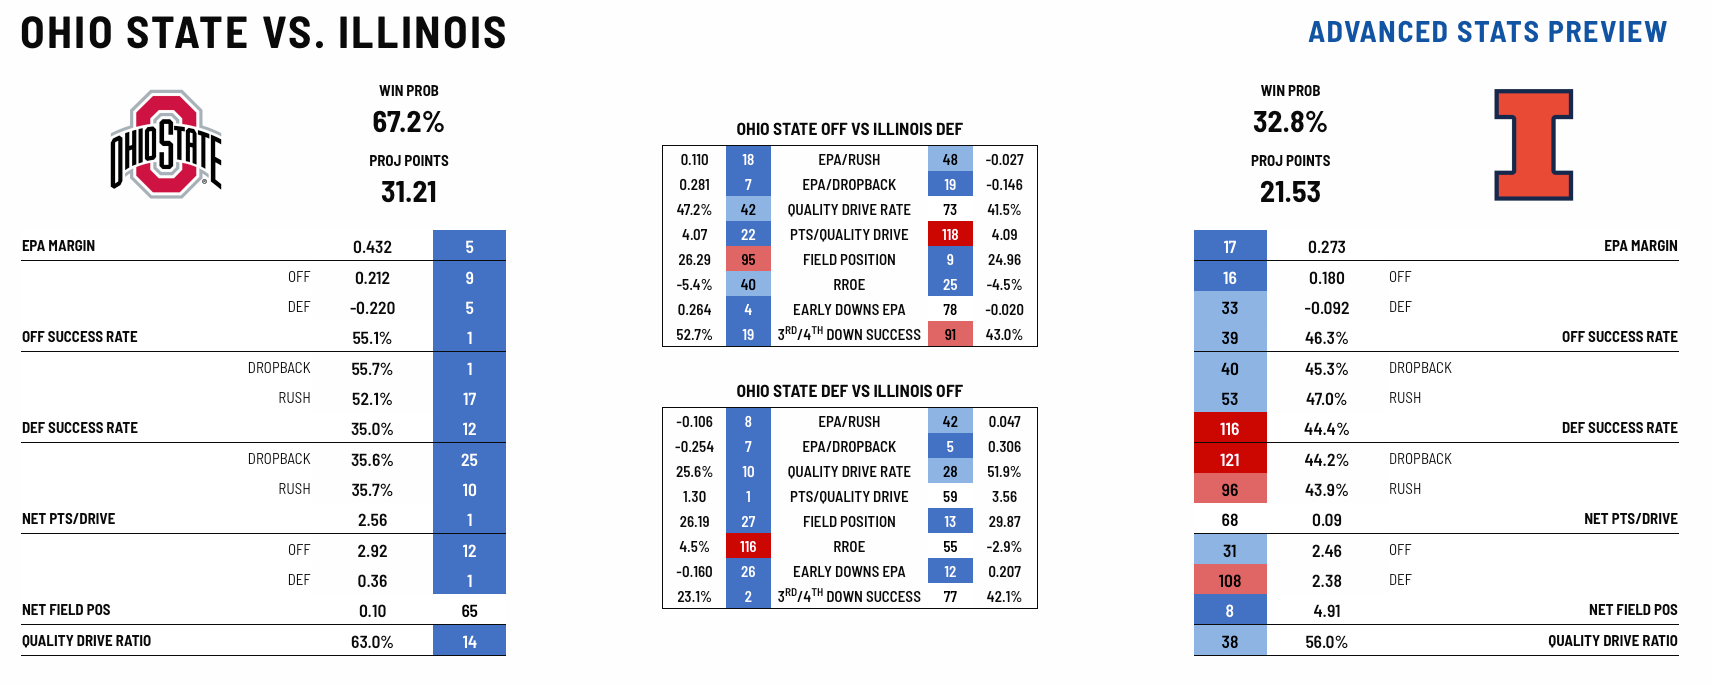
It feels wild that Illinois has a 32.8% win probability against an Ohio State team that ranks among the nation’s best in nearly every statistical category. Meanwhile, Illinois’ defense has some of the worst success rates in college football. This defense both bends and breaks, allowing some of the most points per quality drive in the country.
Illinois does hold one slight advantage: the passing game. The Illini rank fifth nationally in EPA per dropback, compared to Ohio State’s seventh. Still, this matchup is a long shot.
Win or lose, the key is to make it competitive. Show that Illinois belongs on the field with these guys. Because if it turns into another Indiana-type blowout, no one outside of Champaign will take the Illini seriously.
Quick Hitters
I finally dropped the $150 a month for Sports Info Solutions, which opens up access to a lot more data. During the bye week, I’ll be doing a mailbag. I’ll send out question requests this weekend and share what I have access to in case there’s something specific you want me to look up.
For example, I was curious how many halfback draw plays Illinois has run this season. The answer: just two attempts, for a total of 19 yards.
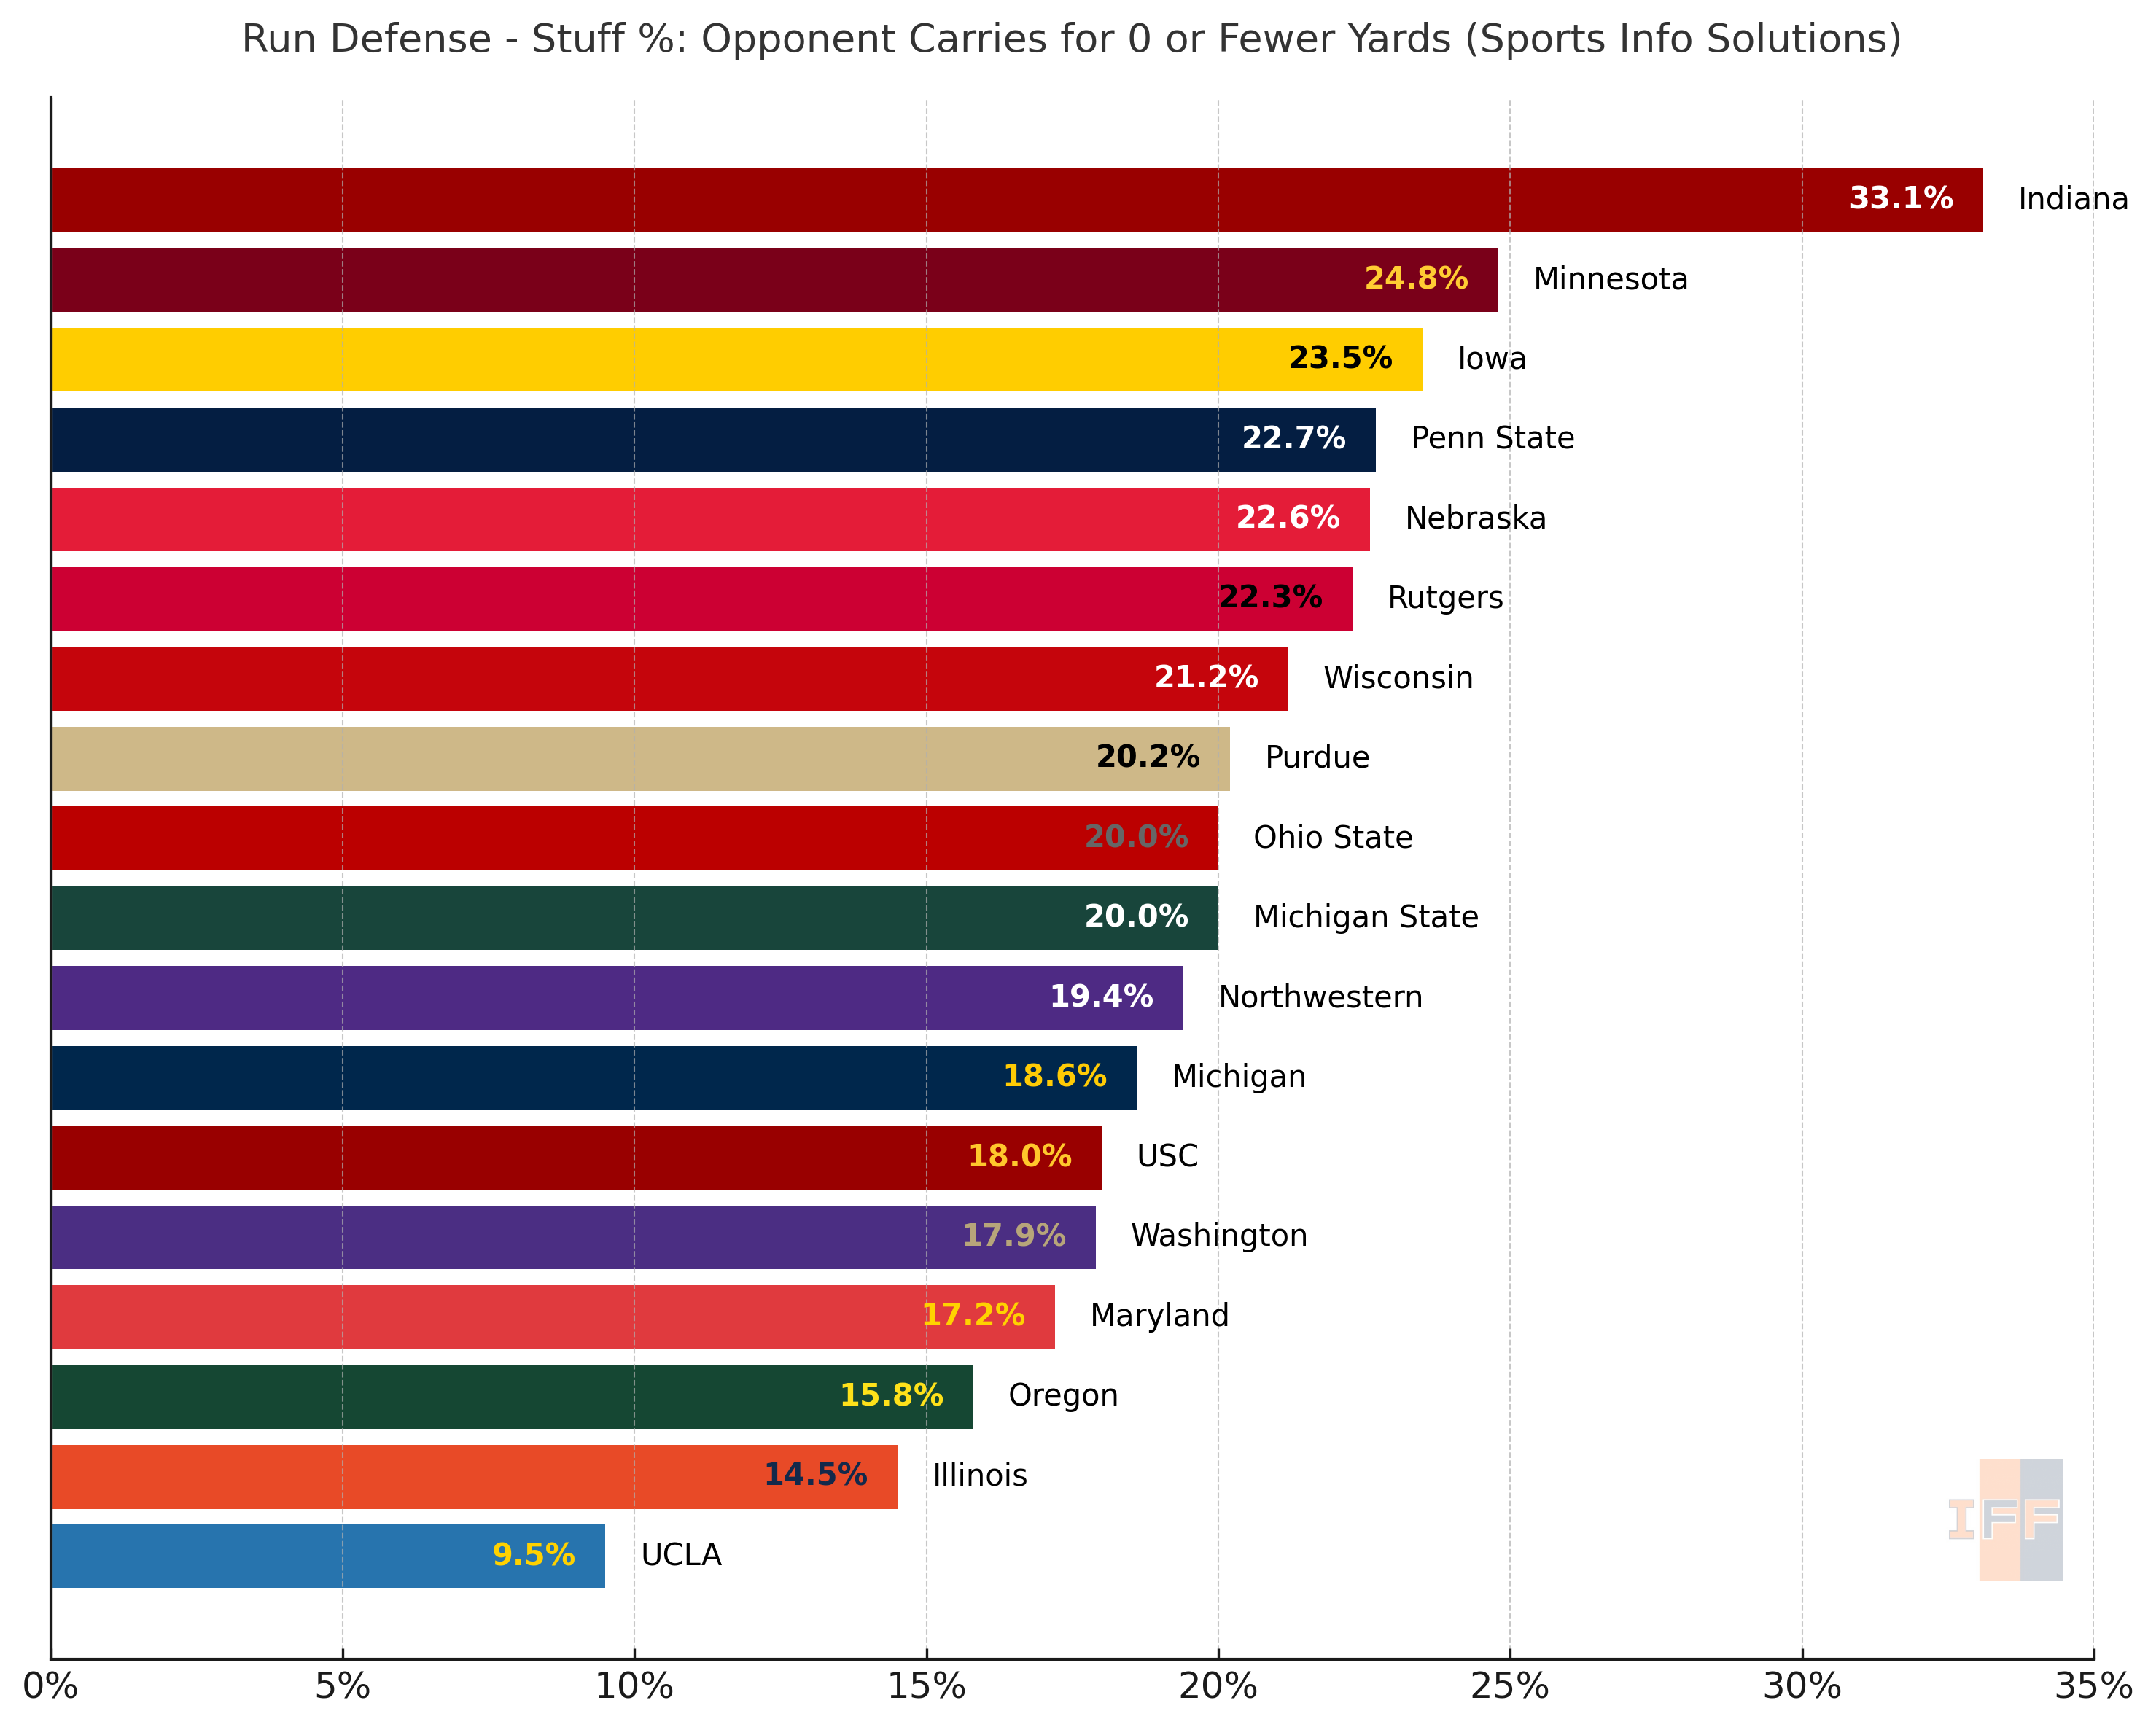
One thing that stood out in the data is how rarely Illinois is stuffing the run.
Stuffs are carries that result in zero or fewer yards, and Illinois’ defense has registered them on only 14.5% of opponent rushing attempts, the second-lowest rate in the Big Ten. Indiana, by comparison, leads the conference with an incredible 33.1% of opponent runs going for no gain or a loss.
The reason Illinois rarely looks good in charts like “Did We Really Get Beat That Bad” is because those visuals measure success rate. Defensively, Illinois has one of the worst success rates in the country. Opponents consistently string together positive plays against them. Offensively, the run game hasn’t been much better.
Success rate is a simple yes-or-no metric: was the play successful or not? A one-yard gain on third-and-one counts the same as a 70-yard gain. Both are considered successful, even though one clearly has far more impact.
That’s where EPA comes in. EPA weights plays based on their actual value. Success rate is black and white; EPA adds the gray that reflects real game impact.
I’ll dive deeper into this during the off week when I break down Big Ten success rate and EPA numbers for every team.